Canada election 2008 - now results by margin of victory
This is another follow-up for this project.
I've managed to now make results that are shaded by the margin of victory. The alpha, or transparency, is a value proportion between 0 and 1. Because the margin of victory rarely goes above, say, 0.4 (40%), then we have to transform that number so that the map doesn't look like a succession of transparent polygons. To each proportion value, I crossed it with a root 8 ("** 0.125" in python). So, a 0.1 margin of victory becomes around 0.75, and 0.2 is 0.8.
Here is a part of the code that I used to customize the poly style:
if totalVotes > 0:

    prop_votes = (maxVotes - secondVotes) * 1.0 / totalVotes

    alpha = int(round(prop_votes ** 0.125 * 256)) * 0x1000000

    color += alpha

if maxVotes == secondVotes or totalVotes == 0: # votes of top two are equal

    color = 0xffffffff

polyStyle.set_color(kmlbase.Color32(color))
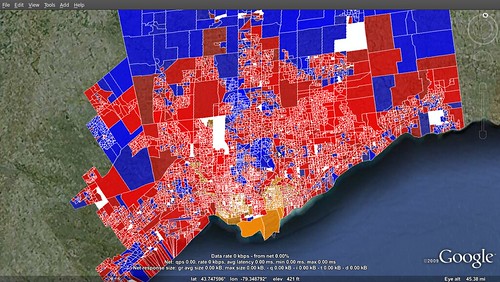
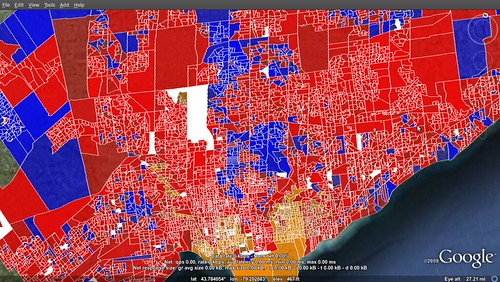
Here is the result for Greater Toronto:
Next step, balloons...
Leave a comment