Recently in Medias Category
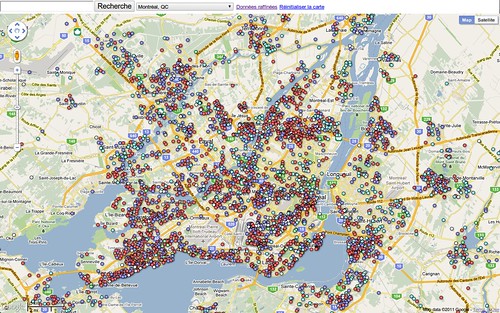
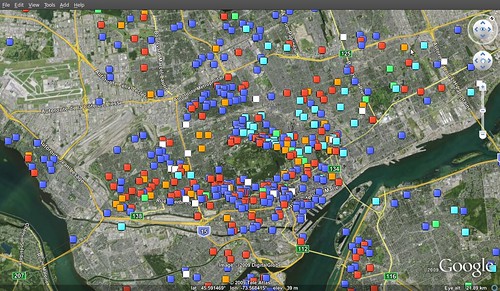
After a few sleepless nights, the political financing map (carte des contributions aux partis politiques) is finally out.
The great thing about doing this project is that we started with what is supposed to be public data and made it actually public. We downloaded it, refined it and mapped it. Although I didn't get around to posting the geocoding results, essentially all the raw data of about 500,000+ entries is made available to the public through Google Fusion Tables. I even used the data I extracted to create my own non-Cyberpresse visualisation (en français).
I think the amount of data displayed will be overwhelming to anyone. Users of the map will be interested to see around places where they live and places that they know, so I think it will be a great platform for crowdsourcing too. I hope you enjoy the map!
Sometime in early 2009, I came up with the Canadian electoral financial contributions project. At the time, I thought it would be awesome to do something with the data that Elections Canada, an independent federal agency in charge of conducting elections and referendums in Canada, releases publicly about funders of political parties. The website contains different ways to access the information, whether it is political party or riding association annual returns or by candidate's expenses during an election.
I wrote a basic how-to, pointing out how obfuscated the browsing of the data was. You can technically download CSVs of the data, but Elections Canada's servers would time-out if you asked for the entire dataset at once.
Try to do mashups with this
There were also some cleverly hidden public data that consists in the postal code of a single contributor. Using a Web browser, it was impossible to compile this data into a database. But using simple scripts with a command-line tool like curl, it was possible to know the location that a donor used to make its donation, including private residence. It might be of questionable good taste to reveal those on a map, but in an era of data mashups and visualisation, it makes perfect sense for what is after all public data.
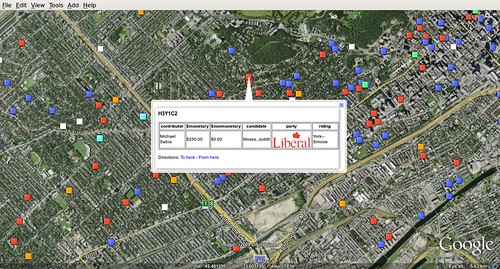
Michael Sabia (Caisse de dépôt et placement du Québec President / CEO) gave money to the Liberals
At the time, I demonstrated my method with only 2008 data and let the project die for lack of interest and time. In the meanwhile, I moved to Hong Kong and started a new career over here, and have been working on data projects.
Now that elections are looming in Canada, and with an improved skill set, I've unearthed the project a week or so ago, and started really digging into it since yesterday. I already reached the stage of collecting all the 2007-2009 data from annual transaction return, and the postal codes of contributors. I am now geocoding the postal codes and will be thinking of ways to offer a better filter and search the data. Aside from mapping the data geographically, I think that it would be interesting to show trends in the data, of where the money went, etc. For the public, it would be interesting to offer a focus on where celebrities and important people put their money, just like the Huffington Post's Fundrace did in the US.
---
Update 2011-04-16: This is the raw data
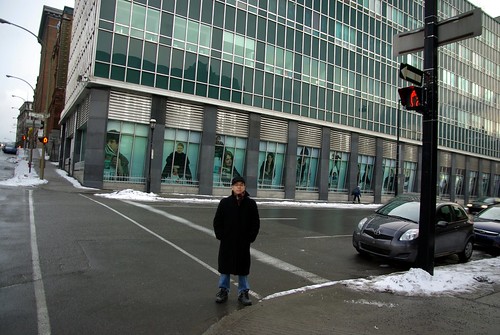
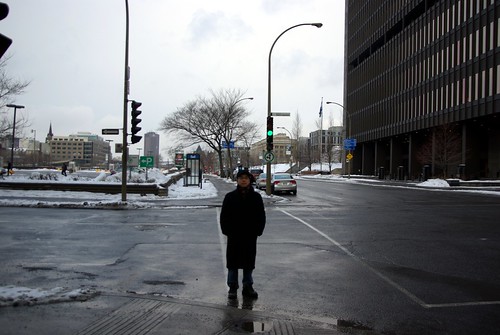
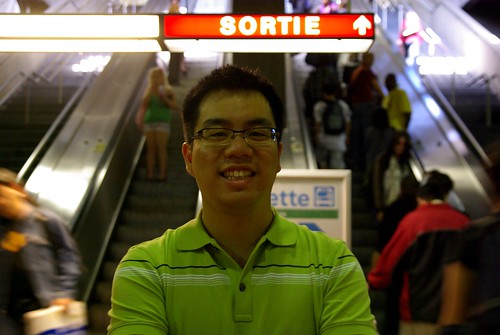
Mon père (un photographe émérite) a pris ces photos de moi devant le bâtiment du journal La Presse, et puis avec au loin la Maison de Radio-Canada derrière mon épaule droite. C'était à l'angle de la rue Saint-Antoine et du boulevard Saint-Laurent.
https://earth.smurfmatic.net/canada2008/polls/
Inspired by Stephen Taylor's post (and my own past project from Fall 2008), I set out to produce a website where people could navigate election results by riding, but also by poll.
I used cartographic data from the Geogratis.gc.ca website. I imported the Shapefiles to a PostgreSQL database with Postgis. Then, I processed results by polling divisions from the 2008 election, data available on the Elections Canada website. It was put in a separate table on the same database. A custom program in Python using the very handy libkml (a code library developed and supported by Google) took the data and outputted pretty KML code. It was packed as a KMZ and uploaded to my webspace. [E-mail me, if you want to exchange ideas on the code]
The webpage itself is rich in JavaScript and the code can be seen here. I use hashes to make the webpage bookmarkable and loadable with a given riding pre-loaded.
For instance, the Papineau riding (24048) can be accessed through this link:
https://earth.smurfmatic.net/canada2008/polls/#24048
The website requires the Google Earth plugin, available for Windows and Mac. It works very smoothly on my old computer (bought in 2003).
You could also download the individual KMZ files (they are in fact zip files, so on Windows you would rename them with .zip and unzip them with your usual utility). They are at: https://earth.smurfmatic.net/canada2008/polls/ridings/ . However, if I post updates (which I will), you won't see them.
Download the KMZ / Téléchargez le KMZ
Finally finished the first phase of my data visualization project for electoral donations to political parties. The data is for individual contributions during the 2008 election in Fall. Here is the KMZ file: contrib40_2009-09-11.kmz
Finalement, j'ai fini la première phase de mon projet de visualisation de données de contributions aux partis politiques. Les données sont pour les dons de particuliers lors de l'élection d'automne 2008. Voici le fichier KMZ: contrib40_2009-09-11.kmz
Here are a few examples of stuff that I found while fooling around... / Voici quelques exemples que j'ai trouvé en me promenant...
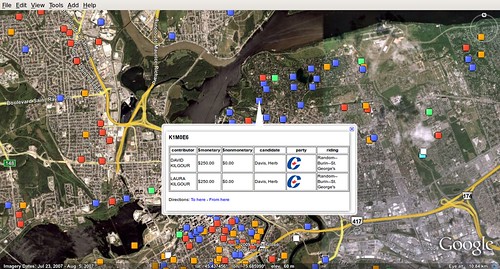
David Kilgour gives to the Conservative Party. We think it's _the_ David Kilgour, because wife Laura is also listed for the same postal code. For the notice, Kilgour was a former Jean Chrétien minister (originally was a Progressive Conservative). Retired as an independent in 2006 and known to be a Falun Gong sympathizer.
Michael Sabia, the Caisse de dépôt et de placement du Québec CEO, formerly a Bell Canada CEO, naturally gives to the Liberals.
Edit (2009-11-11): I completed the project a few days after describing it in this post. This link gives you an overview of what it does. Here is the web version (requires Google Earth plugin): https://earth.smurfmatic.net/canada2008/contributions/
***
Some time ago, I wrote a lot on this particular project without providing much specifics. This said project is the electoral contributions project.
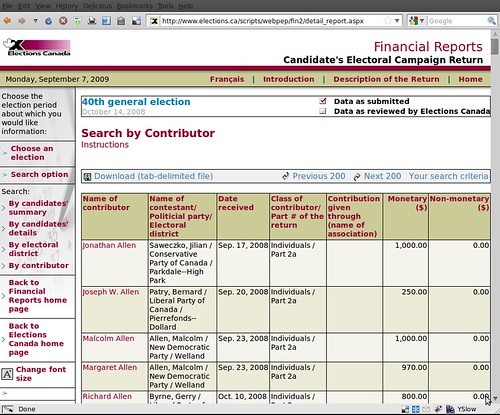
The idea is pretty straightforward. Once a year, Elections Canada releases data on donations to political parties, whether it's from individuals or companies, directly to candidates or the party itself.
They have some database behind to power it, but none of it is open to the public. The only information available is under the form of webpages such as this one:
Also, you can click on the name of a contributor and find basic info such as the address where he sent his contribution from, specifically on this popup:
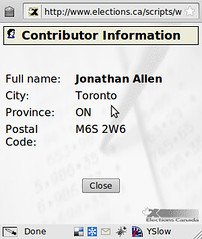
So, what if you got the data and tried to use the postal code to put every contribution on a map? It's been done in the States by the Huffington Post, the well-known web media outlet.
How to do it?
To get the 100-something pages containing the data, you write a shell script with wget on the address (check the post data with Firebug) and download all the pages. Then, do the same for the pop-ups (you find their script's URL by reading through their JavaScript code, all of which is ungarbled).
Then, parse the pages with a script. I wrote mine in PHP, because I didn't know better. I'll post it if there is interest for it. Then, the same script does the INSERTs to the PostgreSQL database. You can download this following database dump:
I chose the columns to be of a super permissive datatype, because the data in those webpages is surprisingly not very well normalized. You also find invalid postal codes and basically no practical way to identify two different donors with, say, the same name.
Then comes the interesting part that I've finished once but did not save anything useful, that is to visualize the contributions geographically with the postal code. I made a separate table called "postalcodes" which is a unique list of postal codes contained in contrib40, and the geographical point representing this postal code. I obtained the point coordinates using a script that called the Google HTTP geocoding service. It's for Postgis that I used PostgreSQL.
Now it's maybe the fun part, that is to fetch the data and make it into something useful, either using MapServer + Google Maps, or libkml (to generate a file for Google Earth).
Interesting, telling uses? Since we only have access to data up to the end of 2008, we could show the rise of the Liberals in the post-electoral months of November and December, when Stéphane Dion stepped down in favour of maybe-Michael Ignatieff. We can surely superimpose donation origin and actual voting patterns at the poll level.
If you have more visualization ideas, feel free to drop me a line: cedricsam@gmail.com. I'd like to hear your ideas, propositions. I think that this data ought to democratized, and using graphical methods like maps is one of the best methods nowadays.
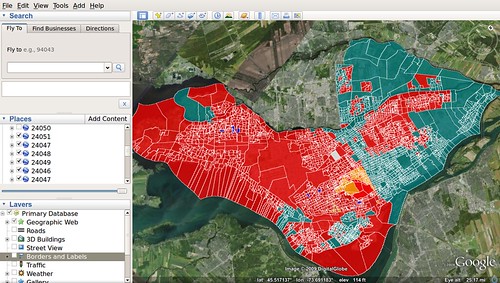
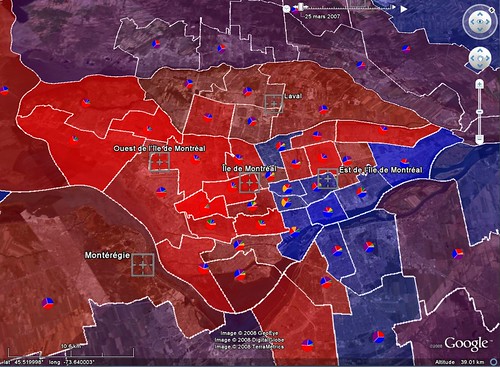
S'il y a des luttes serrées sur l'Île de Montréal, ça risque fort bien d'être celles que se livreront le Parti libéral du Canada et le Bloc Québécois pour Papineau et Ahuntsic.
Ces deux circonscriptions du nord de la Ville de Montréal se sont promenés entre le bleu-vert et le rouge durant ces dernières années. Autrefois des châteaux-forts libéraux, ces circonscriptions sont maintenant des toss-ups sur l'Île de Montréal (avec aussi Verdun).
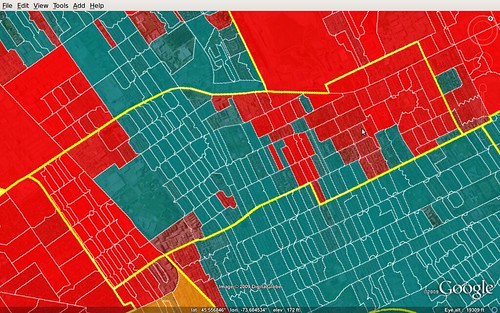
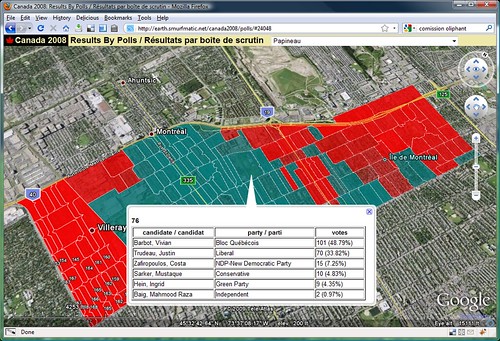
Papineau, qu'on voit ci-haut, c'est la circonscription de Justin Trudeau, fils de feu Pierre Trudeau. Trudeau Sr. avait d'ailleurs occupé la circonscription voisine de Mont-Royal, maintenant siège de l'ancien ministre de la Justice et prof à McGill Irwin Cotler. Papineau fût le siège du ministre Pettigrew du temps de Jean Chrétien. La Bloquiste Vivian Barbot n'aura siégé qu'un peu plus de deux ans aux Communes.
Si on regarde les résultats par scrutin, on voit bien que la portion Parc-Extension de Papineau vote en masse pour les Libéraux, alors qu'entre le Parc Jarry et le Parc Villeray (tout autour de la rue St-Denis), on préfère le Bloc. Plus loin à l'est, dans St-Michel, on a tendence à voter pour les Rouges.

Dans Ahuntsic, c'est le duel entre Maria Mourani (BQ) et Eleni Bakopanos (PLC) qui retient l'attention. Ces femmes se sont bataillées pour le siège pendant trois élections de suite et peut-être une quatrième à venir, si fédérales 2009 elles y ont lieu.
Ahuntsic est l'autre circonscription remarquablement divisée, avec une forte majorité d'électeurs votant pour les Libéraux vivant au sud-ouest de St-Laurent et une majorité d'électeurs pour les Bloquistes au nord-est.
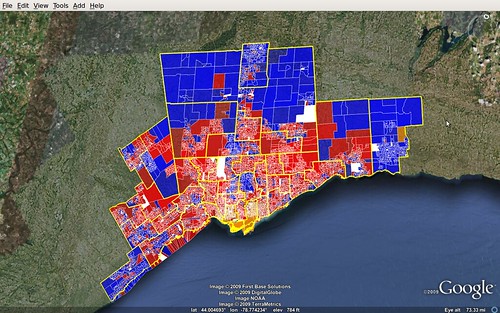
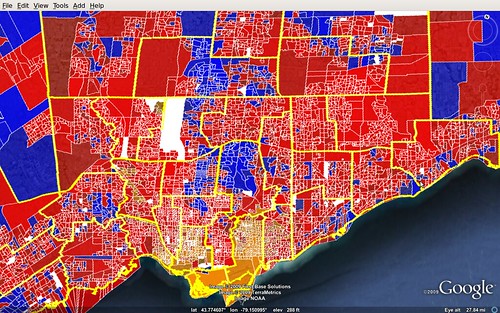
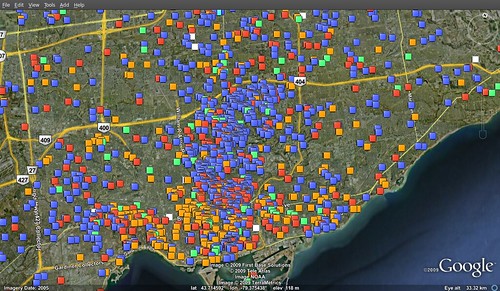
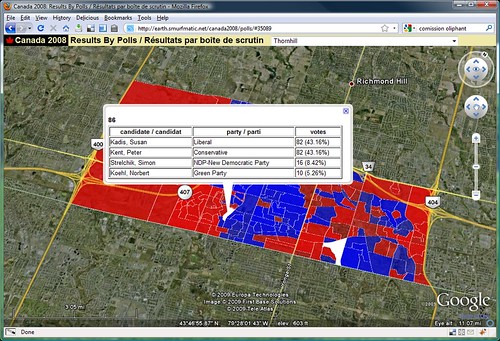
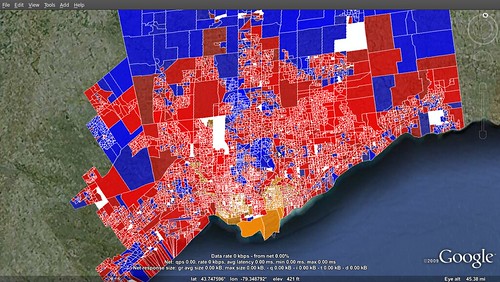
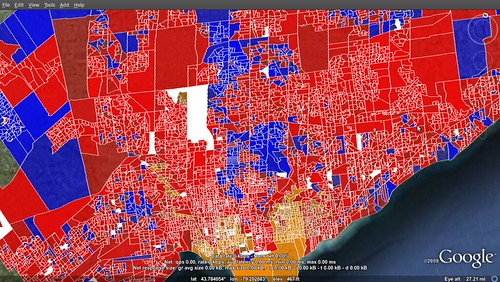
In these two shots of Greater Toronto, I coloured the polls per winner, with shades representing the margin of victory.
Not too surprisingly, the NDP dominate the most urban neighbourhoods, while the suburbs are shared between Conservatives and Liberals, with a greater dominance by Deep Blue in the outer rings, and that of Deep Red within the inner suburbs.
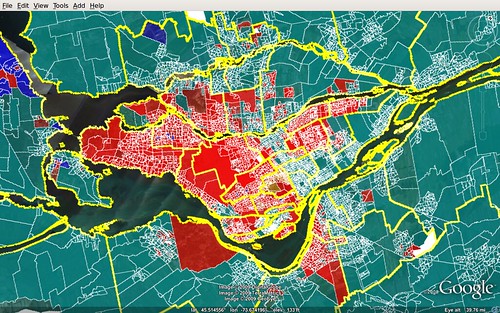
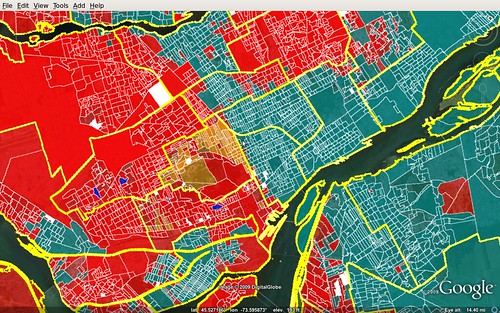
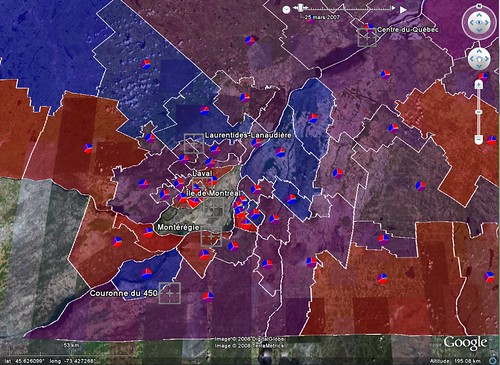
In Montreal, the portrait is a bit more interesting, with very deep divisions. Most of the area outside of the island of Montreal votes Bloc, so does the North-east part of Montreal, where a French-speaking majority resides.
The only places that're notably blue? Hudson, an old English-speaking town and NDP leader Jack Layton's hometown, too. And Saint-Lazare.
This is another follow-up for this project.
I've managed to now make results that are shaded by the margin of victory. The alpha, or transparency, is a value proportion between 0 and 1. Because the margin of victory rarely goes above, say, 0.4 (40%), then we have to transform that number so that the map doesn't look like a succession of transparent polygons. To each proportion value, I crossed it with a root 8 ("** 0.125" in python). So, a 0.1 margin of victory becomes around 0.75, and 0.2 is 0.8.
Here is a part of the code that I used to customize the poly style:
if totalVotes > 0:

    prop_votes = (maxVotes - secondVotes) * 1.0 / totalVotes

    alpha = int(round(prop_votes ** 0.125 * 256)) * 0x1000000

    color += alpha

if maxVotes == secondVotes or totalVotes == 0: # votes of top two are equal

    color = 0xffffffff

polyStyle.set_color(kmlbase.Color32(color))
Here is the result for Greater Toronto:
Next step, balloons...
This is a follow-up to the project discussed here.
I have now advanced my code (about 120 lines in Python) to generate the maps color-coded with the poll's winner in the 2008 federal general election. With an example such as the island of Montreal, it would probably be even more interesting to merge it with census data, for instance the % of francophones or % of people born outside of Canada. From one's informal appreciation of Montreal's linguistic diversity, one can definetely see where the Bloc votes mainly come from. As well, we can't really see polls voting massively for the Conservatives, besides a few in the West Island.
Like we say, the future is now, and it's way simpler than we think.
The KML file for each riding is at this point around 200-300Kb, which becomes almost nothing once compressed to KMZ (expect a 1/10 size reduction). This becomes a very "portable" product, as the KMLs could be pre-generated, editorialized and served to the general public without any need to "carry around" the back-end. A more custom version of the script (coloured by proportional votes per party, say) could even be used by political parties to plan the next campaign, which could happen in Fall 2009.
Next steps: 1- transparency that will give an idea of how deep the margin of victory is in each riding and 2- clickable info windows. When I'll finish these, I'll have re-built my 2008 app from scratch, albeit with a much cleaner infrastructure (now with Python + libkml and PostgreSQL/Postgis, instead of a bunch of PHP scripts and non-spatial MySQL), which should allow me to speed up development time by a lot for customizations, etc.
For client-side performance issues, we can eventually use a combination of MapServer and TileCache, and then serve the data from a platform like Google Maps or any other competing one.
So right now I am working on an experimental project to produce a mashup with the electoral data down to the polling station level.
Right now, I imported the data from the Shapefile provided free of charge on Geogratis to a PostgreSQL w/ Postgis database.
I am then using the libkml library (with SWIG bindings) to merge the data from postgis. Postgis conveniently has a SQL function called "ST_AsKML()" that outputs the geometry as the corresponding KML code. Here is the code that I used:
#!/usr/bin/env python

import sys
import pg
import kmlbase
import kmldom
import kmlengine

def usage():
    return 'usage: riding.py [fed_num]'

def main():
    if len(sys.argv) > 1:
	if len(sys.argv[1]) != 5:
	   print usage()
	   return False
	factory = kmldom.KmlFactory_GetFactory()
	docu = factory.CreateDocument()
	docu.set_name(sys.argv[1])
	kml = factory.CreateKml()
	kml.set_feature(docu)
	conn = pg.connect('postgis', '127.0.0.1', 5432, None, None, 'DB_NAME', 'DB_PASS')
	rows = conn.query('SELECT pd_id, pd_num, pd_nbr_sfx, pd_type, adv_poll, ed_id, fed_num, ST_AsKML(the_geom) as boundary FROM pd308_a WHERE fed_num = %05d ORDER BY pd_num ' % int(sys.argv[1]))
	res = rows.dictresult()
	for poll in res:
	    pl = factory.CreatePlacemark()
	    pl.set_name(str(poll['pd_num']))
	    kmlfile,errors = kmlengine.KmlFile.CreateFromParse(poll['boundary'])
	    mg = kmldom.AsMultiGeometry(kmlfile.get_root())
	    pl.set_geometry(mg)
	    docu.add_feature(pl)
	print kmldom.SerializePretty(kml)
    else:
	print usage()

if __name__ == '__main__':
  main()
Run this on the command line with python (my version is 2.6). This code generates a KML file with all the different polls as separate placemarks for any given federal riding. For now, there is no styling or balloons.
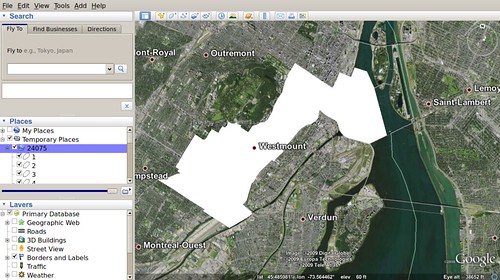
Edit (2009-08-17): Here is the result if I randomize the polygon's colors.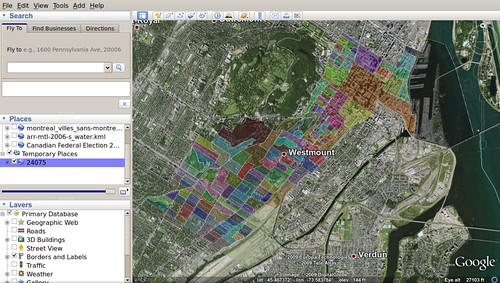
Download this generated KML (for Westmount--Ville-Marie - 24075)
Almost a year ago, I created a web app that would generate Google Earth maps with electoral districts and present/past results. This same app was adapted for use on national television (my employer until recently) and again adapted for the provincial election in Quebec, two months after the federal one.
Recently, a new app created by well-known (small c) conservative blogger Stephen Taylor (see video here below) was brought to my attention. What Mr. Taylor brings is in fact a very important and interesting level of granularity to the results. Elections Canada raw data for polling stations has for a long time been made available to everyone. What wasn't originally available last year was geographical boundary of the territory covered by each polling station comprised in an electoral riding.
This data is now available along the electoral district data that I originally found on GeoGratis (a Canada Natural Resources website).
The format provided is Shapefile. My original system relied on a MySQL database that kept plain decimal coordinates of electoral districts. Now, I've learned more about spatial geography tools such as PostGIS (a PostgreSQL extension, and the premier way of storing purely geographical features) and geo libraries like GDAL. Using shp2pgsql, I imported the data of this Shapefile to my database. This is currently where I am at.
I think that from there I will be looking at ways to import the results data to my PostgreSQL db. Then, I'll try to use Google's libkml library (code in Python) for managing and creating KML data (which is just XML really).
Because the ridings data is so heavy, perhaps it will be difficult to make a web-based app with every single one of the 308 ridings.
Maybe if this project takes off, I will try to start my contributions project again, which has taken a rest for lack of editorial need.
I wrote my answer to the "But where are you from" project by Schema Magazine, an online publication started by Alden Habacon. Here's the link:
https://www.schemamag.ca/indepth/2009/06/kinda-chinese.html
My friends have pointed me to this Argentinean song by Facundo Cabral called "No soy de aqui, no soy de alla", which could well describe how we might feel about nationality, sense of belonging.
...ou Maisonneuve en direct, j'ai l'impression de lire des commentaires de blogue les uns après les autres... >_< Mais où vont les médias traditionnels?
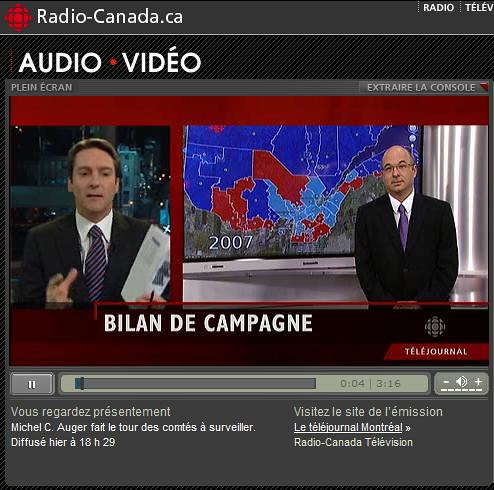
La dernière de Bernard Derome, la démission de Mario Dumont, la courte majorité de Jean Charest... Mais je ne peux pas m'empêcher de ploguer les cartes de Michel C. "Jean Roy" Auger:
Mise à jour (2008-12-11)
Je suis à la photo #26 de cet album par Luc Lavigne.
De plus, je me suis permis de ripper pour YouTube les quatre utilisations de la carte après le call:

Le Point Geek est un site non officiel par l'équipe de production de Radio-Canada.ca. C'est une sorte de Slashdot/Digg de nouvelles intéressantes du domaine technogeek choisies par les programmeurs, développeurs web, designers et webmestres du site Internet de la société d'État.
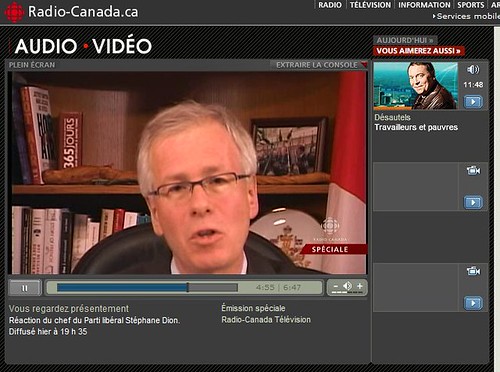
We like Stéphane Dion, but some three minutes into his response to Stephen Harper's address to the nation, the camera awkwardly zooms in into Dion, without maintaining the LPC leader in the middle of the screen. On TV, it was even more noticeable, as he had the RDI ticker right below his throat...
On the other hand, with how closely they shot this, we are able to appreciate the names of some of the books composing Dion's bookshelf. First, he read Hot Air: Meeting Canada's Climate Change Challenge, by Jeffrey Simpson et al. And then, you have 365 Jours pour réfléchir à notre Terre, a photo book by Yann Arthus-Bertrand, famed for his aerial pictures.
The black chair combined with the dark suit made Mr. Dion look like a hunchback...
Maybe they did this quickly to make it a "live" reply to Harper - or maybe the Liberals or the Opposition Leader's office are really out of funds to make a truly compelling video (which also came late to medias and looked a little "warmer" in the colors).
Cyberpresse talks about it.
Lien ici :
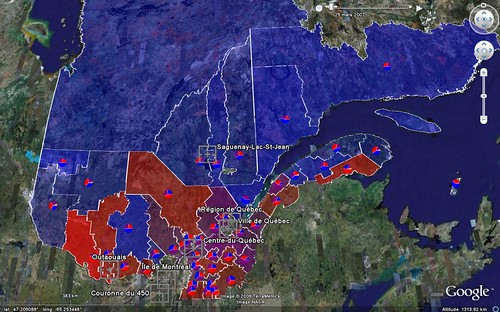
https://earth.smurfmatic.net/quebec2008/
Après la carte des élections fédérales au Canada, voici maintenant la carte des provinciales au Québec à être déclenchées plus tard aujourd'hui.
Les couleurs de celle-ci représentent les partis ayant remporté les dernières élections dans une telle circonscription, que ce soit la dernière générale ou une partielle (aucun gain, donc c'est la même chose - et aussi, on ne tient donc pas compte de la défection des deux adéquistes dans Iberville et Champlain). La profondeur de la couleur indique la marge de victoire (modifiée par une fonction carrée, ensuite ajustée de 15%).
Encore une fois, on obtient les résultats historiques (entre 2003 et 2008) en cliquant sur le graphique circulaire de chaque circonscription (qui représente les derniers résultats). Bon, voici d'autres captures d'écran:
Parlant d'élections, Google a publié une fantastique carte historique (jusqu'au comté près) des résultats de présidentielles américaines de 1980 à 2004. J'imagine que celle de 2008 s'en vient elle aussi. (Lien KMZ)
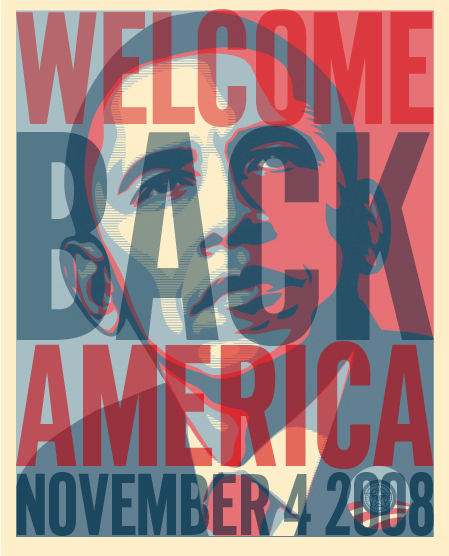
L'activité multi-urbaine post-élection présidentielle Welcome Back America organisée par Spacing (pour lequel j'écris dans sa version montréalaise) s'est faufillée comme l'événement à assister pour célébrer l'élection d'Obama. Y'a la télé de Radio-Canada (RDI, on pense) qui en a parlé, ainsi que le journal 24 heures.
J'avais entendu parlé de l'événement, bien sûr, mais comment ça se fait qu'une activité organisée par une publication anglo (avec un blogue bilingue à Montréal) peut attirer l'attention plus qu'une activité organisée dans le Montréal francophone? Peut-être qu'il n'y a par de démarcation franco/anglo pour ces choses. P-ê que le meilleur score Google aura prévalu?
Bon, allez, je vais voir ce que ç'en a d'l'air. Franchement, je suis un snob de la politique, facque moi c'est la politique provinciale qui m'intéresse. :P

Les Justiciers masqués... Vu qu'on les a connu dans le temps, on veut saluer quand même qu'ils aient mis Montréal (ou le Canada, en fait) sur la carte électorale américaine. Ça c'est une entrevue radio bien intéressante faite avec Christiane Charette et leur ancien prof d'histoire à Brébeuf André Champagne en septembre sur les ondes de Radio-Canada.
The Masked Avengers. Yes, we knew them back then, and we still want to salute them for putting Montreal (or Canada, in fact) on the American electoral map, so to speak. This is a radio interview made with Christiane Charette (hosting the kinda French version of CBC's The Current) and their high school history teacher / radio personality André Champagne this September.
The program that generates Canadian elections maps for Google Earth was used on Radio-Canada Television (CBC's French equivalent). Michel C. Auger, our top political analyst at R-C, did a demonstration using a before and after map of the Toronto Greater Area, where the Conservatives took a large number of seats during the past election.
Also, results are up on my web version:
https://earth.smurfmatic.net/canada2008/
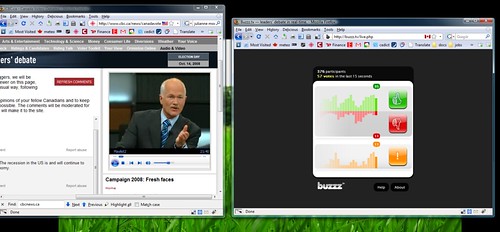
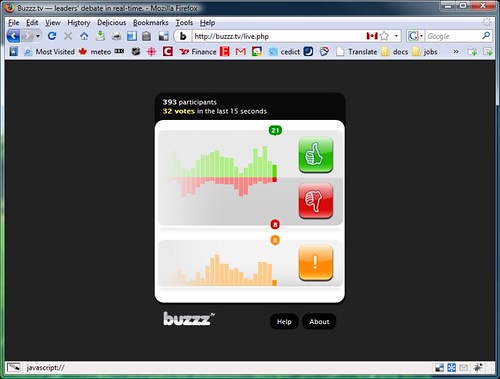
Hey, I finally get to use buzzz.tv on the Canadian party leaders' debate. Harper's getting gang-banged again. He sounds very patronizing by calling every other leader by their first name while they in turn keep calling him Mr. Harper. The host is nothing as good as Stéphan Bureau.
(Hey, it's like Elizabeth May is defending Stéphane Dion!)
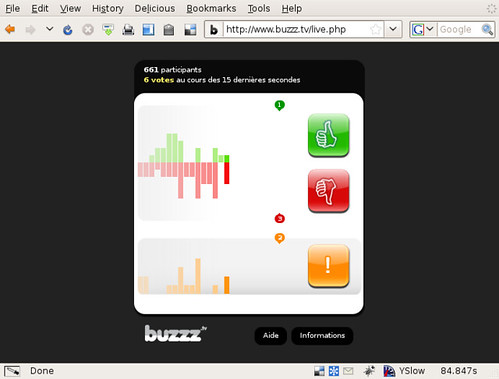
On a beaucoup parlé de Buzzz.tv, dans les derniers jours. Mais quoi, y'a juste 663 participants à six minutes du débat? Pis il est 20h maintenant, et on est 721... J'espère que ça plantera pas!
Mise à jour: bon, finalement, y'a eu trop de monde...
Michel Vastel died today. He was a well-known columnist, journalist in the French-language media. He also has a blogue, and some of the comments left on his last entry before cancer took him (would you still be blogging if you knew you only had a few days to live?) sound extremely weird (like #33, and afterwards, when his passing away had been announced). It's not even like the book at the funeral home, because the messages are still addressed to him, the blogger.
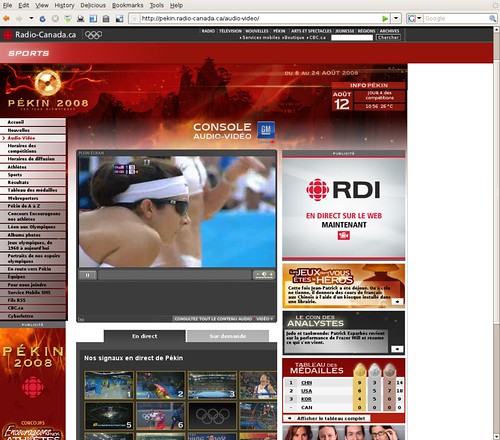
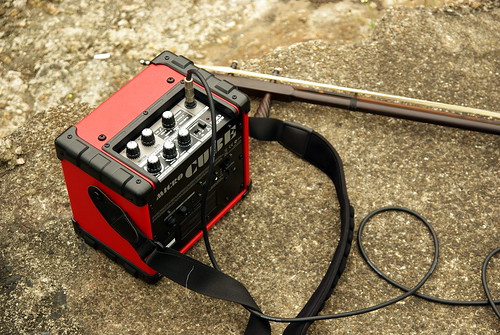
One of the most interesting features of Radio-Canada's Beijing 2008 website (the official national broadcaster for the Games) is the twelve live streams on its audio-video zone. They were splitted from the broadcasting centre, and directly re-transmitted on the web, geo-localized for Canada. The "wall" of video previews below the video embed allows you to browse between the channels.
Perhaps what's cool about these steams is the total absence of commenting on the eleven other feeds not currently being used for traditional television broadcast. For instance, on Sunday, I watched 3/4 of the USA-China game on channel #5, without hearing any of the commentators, emphasizing on the crowd's reaction, and even what the players were saying/cursing (and the bad Chinese pop too).
Eh ben si, j'ai passé à la télé de Radio-Canada, pour parler de mon blogue Comme les Chinois. En prime, Mitsou!
I was on The Link, on Radio-Canada International last Friday, along with Rob, on a panel about what it was to be Chinese Canadian, and the upcoming Beijing Olympics.
>> Listen to the entire show (second hour)
On Tuesday, I started my musical segment on Radio Centre-Ville (mp3 - starts at the 35-40th minute). That was some really intense editing that Yvonne did.
Tomorrow, Thursday July 3rd, there's an interview that I did for Carmel Kilkenny last week that was aired on Radio-Canada International (English) (mp3 - starts at the 18th minute).
Friday, a panel on Canadianess that I am having with RCI will also be aired on the English-language show.
Somewhat relatedly, a dude that I met and interviewed on CLC was on Radio-Canada's Première Chaîne (Radio One) yesterday night at Ailleurs c'est ici (link - starts at the 6-7th minute).
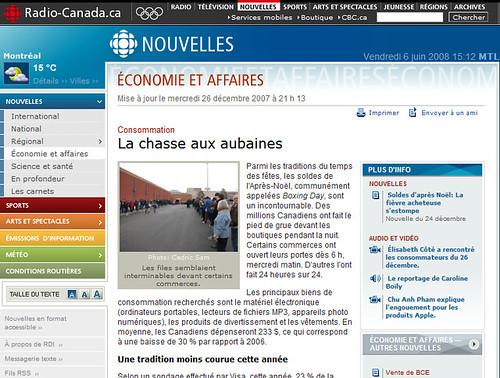
It turned out that a photo that I submitted (along with a few others) to the Radio-Canada.ca news team had been published after all. On Boxing Day, I went around town in search of photo opportunity with my then-new wide-angle lens for my Canon S3, and sent them to the Internet news table. I never heard from them, but a simple Google search on Radio-Canada.ca tells me that one of my less-good pictures was used! (link)
If things move along well, my pics might be seen on the Olympics website, come the complete site launch in August. Okay, for now, here's another recent page (Zone Jeunesse) on the domain that is using one of my very old photos - from 2002.

Last Friday, I published an interview with Yung Chang on Comme les Chinois, whose documentary movie Up the Yangtze, following the lives of people whose home was flooded by the Three Gorges Dam project, came out at the AMC. The French version of the film comes out at Quartier Latin this coming Friday. It was a very relax interview, even if it was the first interviewee in the news on the same week that I was doing. I did not know Yung beforehand, except for bumping into him at the Nouveau Cinema festival, where his film premiered. We then realized that we had a bunch of acquaintances/friends in common... Perhaps the circle of artistically-inclined CBCs of a certain age is really small?
We talked a lot about food, or lack of real good Chinese food in Montreal... And then there was the obligatory questions about the film. While perhaps running the risk of sounding too all over the place, I chose not to ask the obvious questions already heard on The Hour and all of Montreal's free weeklies. I find random, boring questions almost more interesting. Like I was discussing with a previous guest, they always seem to let you discover new things about your guests.
When interviewing people for a short-lived weekly student newspaper (because it was during the last semester of cegep - and that was almost 10 years ago), I thought that interviews always certainly allowed for something new to come out of the interaction between two people, the interviewer and his guest. It is maybe the starting point for awesome ideas like L'autre midi à la table d'à côté, a special radio feature on Radio-Canada's La Première Chaîne.

Steve Faguy wrote a short article about my new blog Comme les Chinois in this morning's Montreal Gazette Saturday Extra section.
My friend Fiona, a Chinese American now living in Beijing, started a new blog about the "gently offbeat in a decidedly uncute city". Check it out!
Last few hours of 2007, and I am launching "Comme les Chinois", a blog on Chinese-Canadianess/Quebecness in this country's both official languages.
Mencoder really does miracles. After showing how to rip streams last week, now comes a script to rip the audio from a music video DVD:
#!/bin/bash
# Script to rip the audio of DVDs (useful for music videos!)

ACODEC=mp3
ABITRATE=128

if [ $# -ne 5 ]
then
    echo "Usage: ripaudiodvd.sh [AID] [TITLE] [START CHAPTER] [END] [SUBDIR]"
    exit 1
else
    OUTDIR=${HOME}/ripdvdaudio/${5}
    mkdir -p ${OUTDIR}
    for i in `seq ${3} ${4}`
    do
       TRACKNO=`printf %02d $i`
       mencoder -v dvd://${2} -aid ${1} -chapter ${i}-${i} \
       -o ${OUTDIR}/track${TRACKNO}.${ACODEC} -ovc copy -oac lavc \
       -lavcopts abitrate=${ABITRATE}:acodec=${ACODEC} -of rawaudio
    done
fi
Download it: ripdvdaudio.sh

Radio-Canada Nouveaux Médias is rebranded Radio-Canada Internet et Services Numériques, and Geneviève Rossier, interim first director for the past two months, since taking over from Yann Paquet and Jean-François Rioux (interim), was officially crowned as its new directrice générale. Ms Rossier has been with Radio-Canada since 1984, and might be best remembered by the general public as a reporter for SRC Information.
From what was previously a "first director" top dog position at the New Medias, the bearer of the internet general director title is now on par with its radio, television, comm, sales, etc, counterparts.
The following script uses the mencoder command to read a live video feed and save it to a file for playback. It could probably be modified or used as it is for audio, but I did not try it. It was custom-made to read a stream in the asf format and encoded in WMV3 (Windows Media Video 9), but I assume that it could be parametrized to take and output other formats. The benefit of this script is that it does not require any transformation or recoding of the stream, as it just copies (or dumps) the contents of the stream to a file, and packages it in its native format, that's supported by FFmpeg's libavformat library.
#!/bin/bash
# Reads a live stream and copies its contents to a file

NOW=`date +%Y%m%d%H%M`;
DLDIR="~/"
EXTENSION="wmv"
FORMAT="asf"

if [ $# -ne 3 ]
then
    echo "Usage: savestream.sh [stream url] [duration] [identifier]"
    exit 1
else
    STREAM_URL=${1}
    DURATION=${2}
    IDENTIFIER=${3}
    mencoder -forceidx -oac copy -ovc copy -endpos ${DURATION} -vf harddup ${STREAM_URL} \
    -of lavf -lavfopts format=${FORMAT} -o ${DLDIR}/${IDENTIFIER}${NOW}.${EXTENSION}
fi

exit 0
Download it: savestream.sh
Whatever you do with this script is your business. Please be careful about legal questions with respect to copyright when you save stream segments.
You need to have MPlayer/mencoder installed. It works best when you have the latest codecs installed, and this script should only work when you have FFmpeg installed too (although I think you could modify it to do without). You might also need the w32codecs binary codecs package.To get the latest versions of these packages, on Debian, try looking at Debian Multimedia, and for Ubuntu, check out Medibuntu. I did not test it thoroughly, so beware when you use the script, and be sure that you know what you are doing! The script works very well as a cron job.
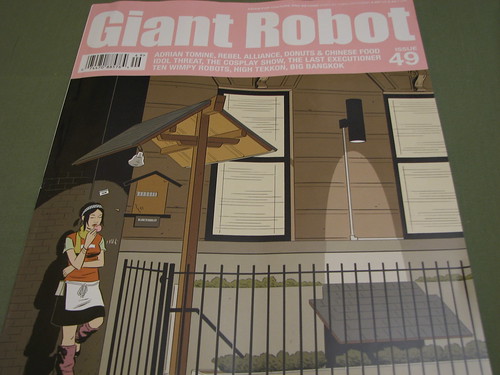
This issue was in the mail this week, and contains interview (and art) by Adrian Tomine, whose drawings can sometimes be admired on the cover of the New Yorker. Also, a survey of the bizarre phenomenon of "Donuts and Chinese Food" restaurants.
Giant Robot is an excellent Asian pop culture magazine contributed to in large part by Eric Nakamura and Martin Wong, and based in Los Angeles, with Giant Robot-branded stores in LA, SF and NYC selling trendy items sometimes featured in its pages.
If you are looking for copies of Giant Robot in Montreal, I once found it at the downtown Chapters' on the specialty magazines stand.
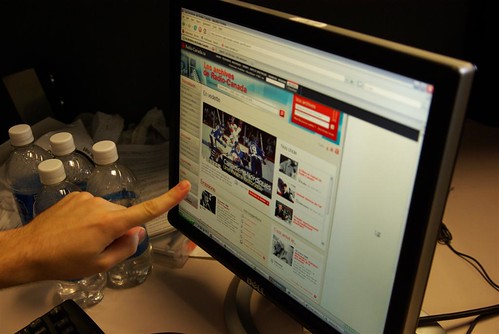
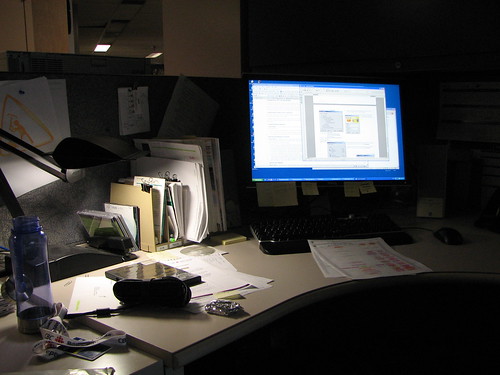
Sort of reasserting my presence online tonight, so here is my cubicle. It's picture taken a month ago, and the stuffs on the walls don't belong to me:
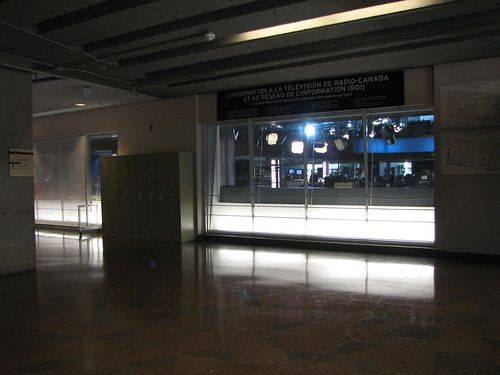
Also, a view of the CDI, the "Centre de l'Information", where RDI (CBC Newsworld's French counterpart), Le Téléjournal (R-C's flagship news program) and Montreal CBC News at Six are shot from:

Well! Radio-Canada seems to have dropped using ActiveX in favour of a shell in Flash for its new Audio-Video zone.
Apparently, Radio-Canada.ca has a new section with multimedia contents... I say "apparently", because it uses ActiveX to deliver the contents, and I can't access it with Firefox! What a choice of web technology, when Flash has become a dominant format for video contents, thanks to Youtube, and while other alternatives like the mix of embedded WMV/QT used by the CBC (R-C's English-language counterpart), or RM/QT used by the Beeb. It's a long way from using an open standard for multimedia (I don't think OGG really caught up), but at least don't try to go in the opposite direction...
There is a webpage for distraught Firefox users, and there is nonetheless an ActiveX plugin for Firefox, but only up to version 1.5. Widespread adoption of Microsoft technology within R-C (even compared with their anglo counterparts) really stirs a lot of incomprehension inside me. Shouldn't a state-funded body try to be a little more independent from big software companies, or be a leader in adopting and promoting new technology standards?
So, I am looking forward to Dragon Boys, a mini-series on Vancouver's Asian gang scene that is airing on the Ceeb January 7 and 8. For sure, it still plays the same way The Godfather plays for Italian-Americans, but as one of the cast members defends it: still makes for a good story. The part where one of the Canadian-Chinese characters (the RCMP officer, I think) corrects the white woman that a samurai is a Japanese concept is sweet. Will have it marked on my calendar, nonetheless.
I also found it amusing that the premiere screening was organized by SFU's "Canadianized Asian Club", which sounds very much like a tongue-in-cheek name to give one's ethnic club, unless they take it seriously, and where I think that it pushes the categorization of visible minorities very far. The context (Vancouver) surely applies for such compartmentalization, but even at McGill, there were at least three main "Asian" clubs from the time when I was a student (99-04), namely the Chinese one (MCSS), the Taiwanese one (MTSA), and the North American born one (MANABA), as well as a few recent ones that weren't there when I was a student, like the Mainland Chinese one (CSSA - led by a former CTF member, and whose "about us" is the most honest thing I've read in a long time, in that it isn't even trying to be particularly outsider-friendly, as all ethnic societies tend to do at least for show, and probably compliance for student funding), or the Hong Kong one (HKSN - that was totally founded this year), and the presumably defunct ones, like the Chinese Christian one.
Well, my own experience with ethnic societies started with putting a sign-up sheet on a public billboard for an Asian students' society at my old cegep, and ended with someone printing "no to ghettoization" over it. Eventually, it became interesting to know why it was deemed unacceptable there (not only b/c of the message, but b/c noone signed up, except for one or two of my best buddies, for encouragement), and why it is tolerated in other places, by sheer pressure of numbers or by putting sufficient warnings that "we are teh inclusive".
While watching The Hour (woaw, full-length shows! take that, commercial tv), the was an ad about The Little Mosque On The Prairie, which seems like a very good multicultural Canada idea (and also, by the same token, for you CBC geeks out there, that there was an insider CBC blog).
Also, today, France 24 was launched (Live, exclusively on the web). It's in English language too, as it is meant to be a French version of BBC World, CCTV in English, CNN, etc, with the same range.
It's a pretty daring thing to case it at 11PM, right after the National (when it's usually a re-run of the National or some Canadian movie). It's in front of a live audience too. It's a shame that my reception of CBC resembles a snowstorm. The Hour.
The MuchMusic credential is very interesting. As if Patrick Masbourian did a Radio-Canada host show during primetime.