April 2011 Archives
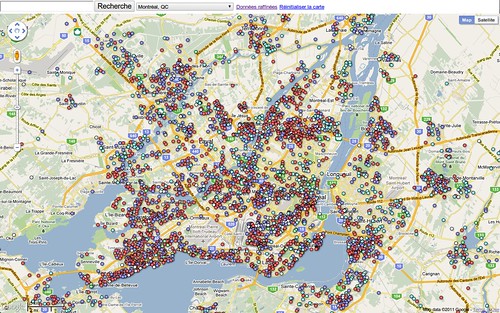
After a few sleepless nights, the political financing map (carte des contributions aux partis politiques) is finally out.
The great thing about doing this project is that we started with what is supposed to be public data and made it actually public. We downloaded it, refined it and mapped it. Although I didn't get around to posting the geocoding results, essentially all the raw data of about 500,000+ entries is made available to the public through Google Fusion Tables. I even used the data I extracted to create my own non-Cyberpresse visualisation (en français).
I think the amount of data displayed will be overwhelming to anyone. Users of the map will be interested to see around places where they live and places that they know, so I think it will be a great platform for crowdsourcing too. I hope you enjoy the map!
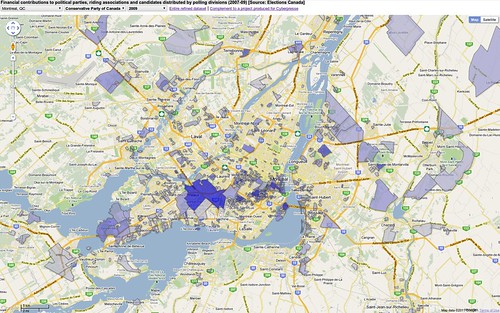
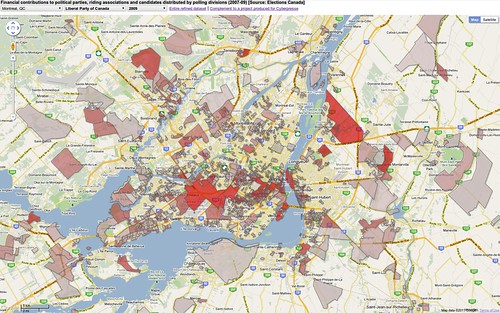
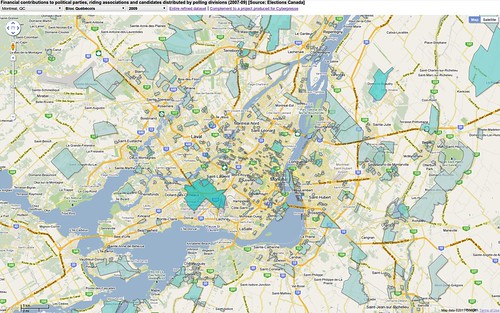
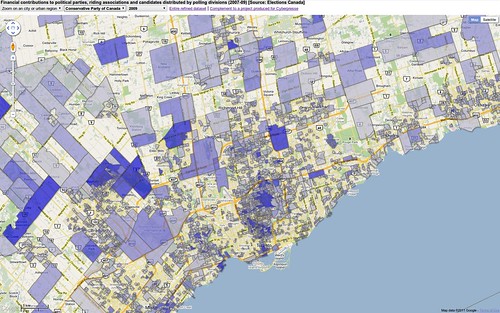
Dernière d'une série de trois, voici un tracé de la provenance des contributions faites aux partis politiques et associations de circonscription en 2009. L'outil d'où proviennent ces captures d'écran sera publié tard vendredi soir, heure de l'est. Samedi matin, la surprise sortira.
(Les dons au NPD et au Parti vert dans la région métropolitaine sont trop minimes pour être montrés ici.)
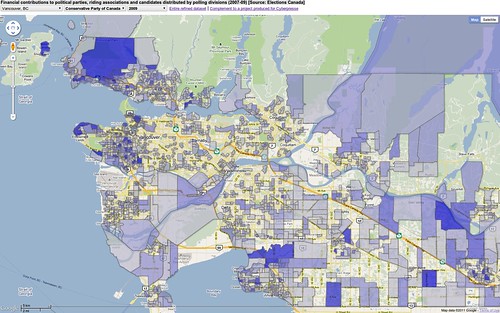
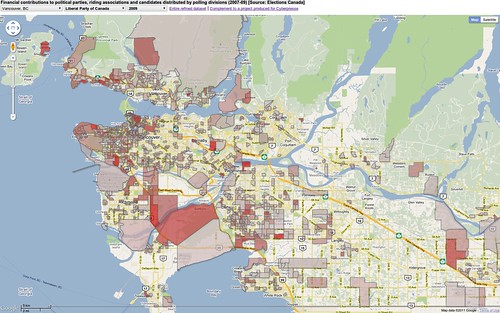
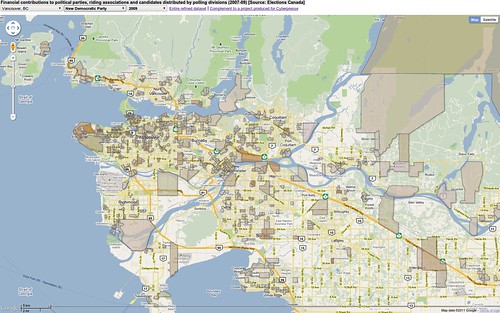
Like I did for Toronto, but this time for Vancouver.
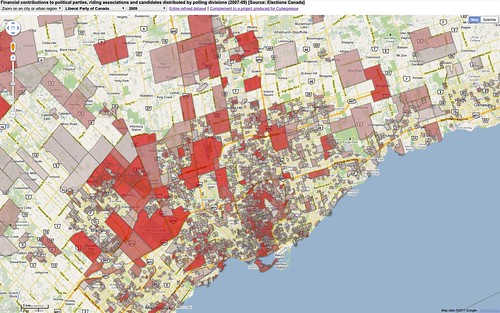
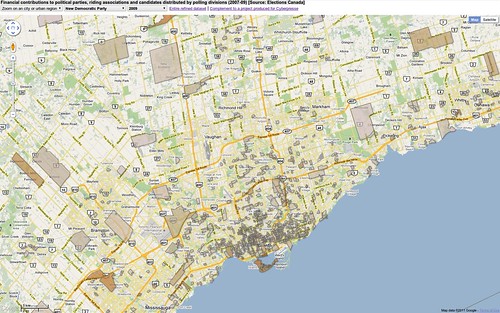
These are the compiled financial contributions to national instances of political parties and riding associations for 2009, distributed among polling divisions (from postal codes of contributors, geocoded when possible). The data was obtained from Elections Canada's website. More to come later, links to come later.
