Electoral contributions to political parties in Canada : the sales pitch
Edit (2009-11-11): I completed the project a few days after describing it in this post. This link gives you an overview of what it does. Here is the web version (requires Google Earth plugin): https://earth.smurfmatic.net/canada2008/contributions/
***
Some time ago, I wrote a lot on this particular project without providing much specifics. This said project is the electoral contributions project.
The idea is pretty straightforward. Once a year, Elections Canada releases data on donations to political parties, whether it's from individuals or companies, directly to candidates or the party itself.
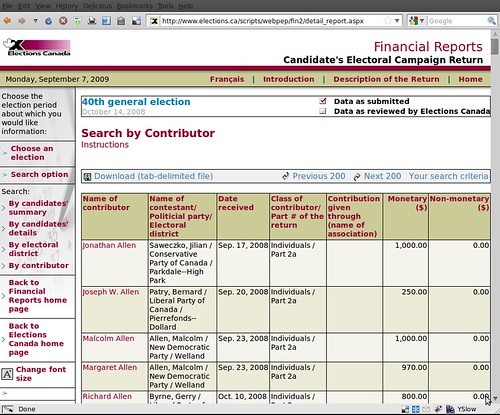
They have some database behind to power it, but none of it is open to the public. The only information available is under the form of webpages such as this one:
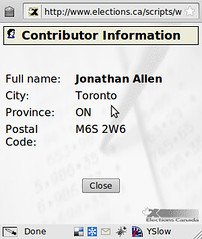
Also, you can click on the name of a contributor and find basic info such as the address where he sent his contribution from, specifically on this popup:
So, what if you got the data and tried to use the postal code to put every contribution on a map? It's been done in the States by the Huffington Post, the well-known web media outlet.
How to do it?
To get the 100-something pages containing the data, you write a shell script with wget on the address (check the post data with Firebug) and download all the pages. Then, do the same for the pop-ups (you find their script's URL by reading through their JavaScript code, all of which is ungarbled).
Then, parse the pages with a script. I wrote mine in PHP, because I didn't know better. I'll post it if there is interest for it. Then, the same script does the INSERTs to the PostgreSQL database. You can download this following database dump:
I chose the columns to be of a super permissive datatype, because the data in those webpages is surprisingly not very well normalized. You also find invalid postal codes and basically no practical way to identify two different donors with, say, the same name.
Then comes the interesting part that I've finished once but did not save anything useful, that is to visualize the contributions geographically with the postal code. I made a separate table called "postalcodes" which is a unique list of postal codes contained in contrib40, and the geographical point representing this postal code. I obtained the point coordinates using a script that called the Google HTTP geocoding service. It's for Postgis that I used PostgreSQL.
Now it's maybe the fun part, that is to fetch the data and make it into something useful, either using MapServer + Google Maps, or libkml (to generate a file for Google Earth).
Interesting, telling uses? Since we only have access to data up to the end of 2008, we could show the rise of the Liberals in the post-electoral months of November and December, when Stéphane Dion stepped down in favour of maybe-Michael Ignatieff. We can surely superimpose donation origin and actual voting patterns at the poll level.
If you have more visualization ideas, feel free to drop me a line: cedricsam@gmail.com. I'd like to hear your ideas, propositions. I think that this data ought to democratized, and using graphical methods like maps is one of the best methods nowadays.
Leave a comment